
The IAS Osprey Inspection System
IAS Osprey.
Automatic defect inspection, built onto your existing line.
IAS Osprey is a defect inspection system built onto the packaging line you already run. It photographs every product, grades it with AI models trained on your own defects, and rejects bad product automatically at line speed. This page covers what the system includes, the performance we have measured, and what it sees in production.
Every performance figure on this page is measured on the running machine, published in a component manufacturer's datasheet, or derived from those two with the derivation on file. None are estimates. Registration and trigger figures describe the controls chain. Mechanical conveyance error, meaning wheel slip, belt stretch and encoder runout, is not included and is qualified on your line, and inspection above 350 ft/min is qualified against installed optics and lighting.
The signal chain
Accuracy at line speed.
Inspection only counts if the accuracy holds at full line speed. IAS Osprey holds it, so every product gets a verdict and every verdict lands on the product that earned it.
Detect
Every product is picked up the moment it enters the inspection zone.
Track
The system follows each product down the line at full line speed.
Image
Each product is photographed at exactly the right moment.
Inspect
AI grades every image against the defect classes that matter for your product.
Reject
Bad product is removed automatically, and every rejection is logged.
Measured on a packaging line
Performance at a glance
| Specification | Value |
|---|---|
| Inspection rate | 339 products per minute measured on a single lane; rate depends on pouch and product size |
| Registration accuracy, controls chain | ±0.002 in at 500 ft/min |
| Camera trigger accuracy, controls chain | ±0.004 in at 500 ft/min |
| Imaging | Camera and optics selected per product being inspected; hardware triggered on position |
| AI inference | Anomaly detection, classification and segmentation, combined per application; models validated against held-out images |
| Coverage | Every product inspected or fail-safe rejected; overlapped product tracked and counted |
| Environment | Stainless construction and washdown rated enclosures available for sanitary areas |
| Line interface | Native EtherNet/IP verdict exchange with the line controller; fails safe on link loss |
| Built and supported | Panels from our UL 508A shop; lifecycle support under Osprey Assist |
The engineered package
What every system includes
- AI runtime. Inference tuned to your line and defect classes.
- On-machine image collector. Capture and labeling by defect class and SKU.
- Operator HMI. Recipes, live defect imagery, counts and plain language faults.
- PLC interface library. Drop-in blocks for native EtherNet/IP verdict exchange.
- Event and image logger. Every verdict logged with its image and timestamps.
- Hardware specified per application. Camera, lighting and compute are selected for your product and defect classes.
- Designed onto your line. The frame is engineered to the conveyance you already run. Where that conveyance cannot carry the inspection, it ships on its own frame or is engineered to your process another way.
Accuracy against line speed
Registration and trigger error
by line speed.
Error grows with speed. Registration error stays under three thousandths of an inch at every speed in the table, including 1000 ft/min, and trigger placement runs from under two thousandths to under seven. Move the sliders to your line and the system's worst case numbers follow.
The measured single lane rate is 339 products per minute at the reference pouch size. The rate on your line depends on pouch size and how far apart the products run. Lane count and rate are confirmed during the fit review.
The published table
| Line speed | Registration error | Trigger error |
|---|---|---|
| 100 ft/min | 0.00118 in | 0.00156 in |
| 200 ft/min | 0.00136 in | 0.00212 in |
| 300 ft/min | 0.00154 in | 0.00268 in |
| 400 ft/min | 0.00172 in | 0.00324 in |
| 500 ft/min | 0.00190 in | 0.00380 in |
| 750 ft/min | 0.00235 in | 0.00520 in |
| 1000 ft/min | 0.00280 in | 0.00660 in |
Figures above 350 ft/min describe controls capability. Inspection at those speeds is qualified against the installed optics and lighting before it is quoted.
Line speed follows from pouch size and pitch
| Product pitch | ft/min | m/min | Products/min |
|---|---|---|---|
| 4 in | 113 | 34.4 | 339 |
| 8 in | 226 | 68.9 | 339 |
| 12 in | 339 | 103.3 | 339 |
Products per minute shown at the measured reference; your rate depends on pouch and product size.
The AI core
How the AI runs in production.
- Multiple inference methods per product. Anomaly detection, defect classification and segmentation, combined per application, and every deployed model is validated against held-out images first.
- Fail-safe by design. No verdict, a missed capture or a broken model all resolve the same way: the product is rejected. Anything the system cannot account for is alarmed and counted, never passed quietly.
- Every product inspected, measured at 339 per minute on a single lane, including overlapped and shingled product.
- Every verdict is logged with its image, timestamps and reject reason, in an audit catalog built for reconciliation.
- It learns your product. On-machine collection captures production frames with their verdict, image and SKU. Models retrain on your product, not a stock dataset.
- Built to be run by operators. Recipe by SKU, on screen tolerance tuning, live defect imagery and a plain language fault list with first-out capture.
Your data and your network
- Your images and defect data remain yours. IAS uses them for one purpose: building and supporting your models. They are never used for another customer's system.
- An NDA is standard before feasibility begins, and image transfer, storage and retention are agreed in the project scope.
- Remote access happens only by the method your IT approves, and the runtime can operate without a plant-external connection where the application requires it.
Validated on real product
Measured on a customer's production line
A food producer brought IAS in for seal inspection on a flexible pouch line. Confirmed defect examples were scarce when training began, so IAS built the training data the models needed: more than 6,700 inspection camera images, over 4,000 individually reviewed annotations, and about 80 model training iterations.
- 80,000+ images captured on the customer's line at production speed, separate from the training set above, across multi-day test sessions with two cameras acquiring simultaneously, with no missed triggers and no dropped verdicts: the full round trip from registration sensor to camera to inference to the PLC verdict, at production rate.
- The primary seal defect model deployed at 99.1% measured precision, validated against held-out images the model never trained on, with under 1% of good product falsely rejected at the production confidence threshold on the validation set.
- The vision runtime passed 362 automated tests before it ran on the line.
- No honest vendor promises 100% detection. These results are one application. Escape rates and catch rates for your product are measured during your validation and delivered in your validation report, never assumed from ours, and never from a brochure.
Fitting the line you have
The work is a retrofit engineered to your process, not the other way around. Inspection can mount over your existing conveyance, run on its own frame, or handle product another way, such as a robotic arm presenting product to the camera. Stainless construction and washdown rated enclosures are available where the area requires them, and the verdict exchange is native EtherNet/IP into your line controller, failing safe if the link drops.
The demonstration set
Defect samples through the
inspection camera.
Real physical defect samples. To show the difference, we photographed each one two ways for this demonstration: on the bench as an operator sees it, and through the inline inspection camera.
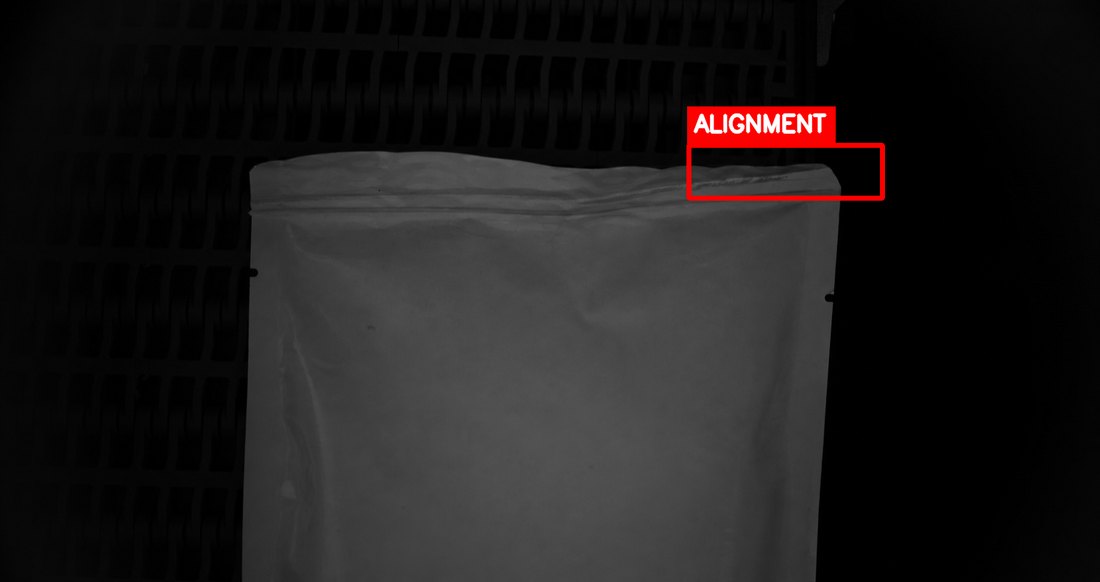
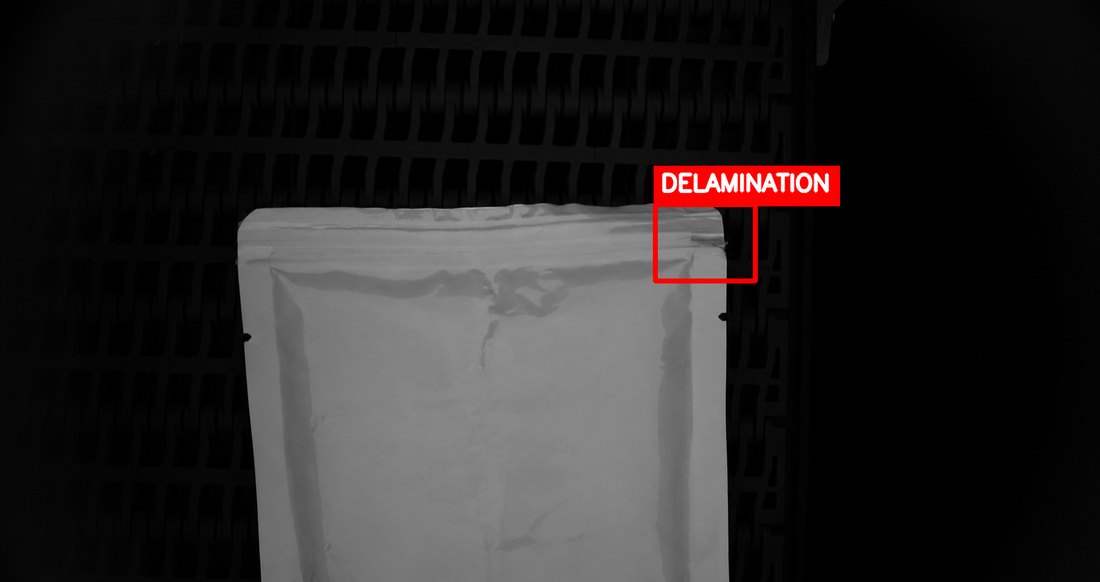
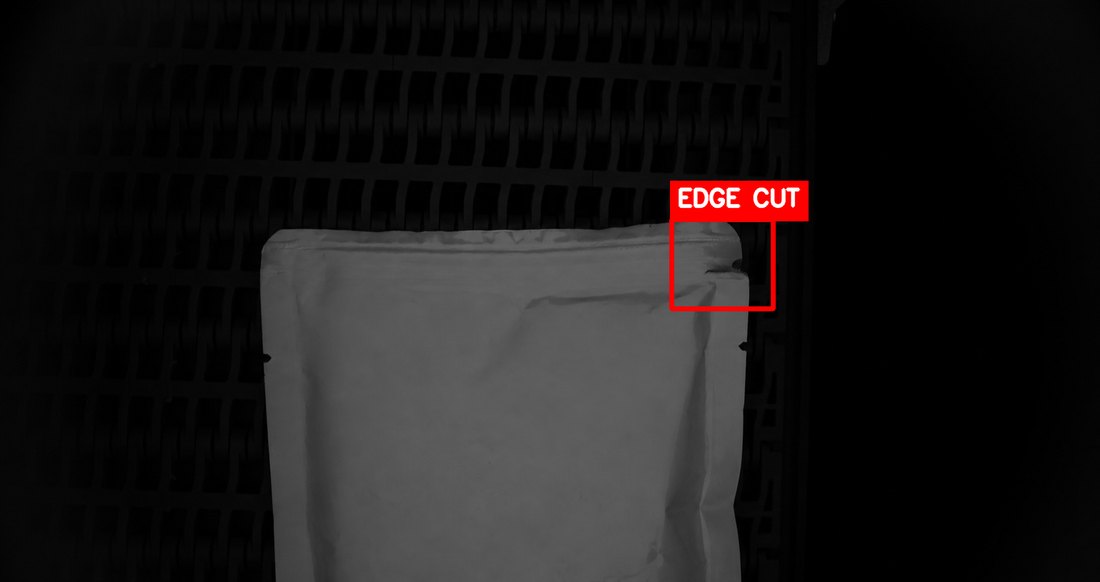
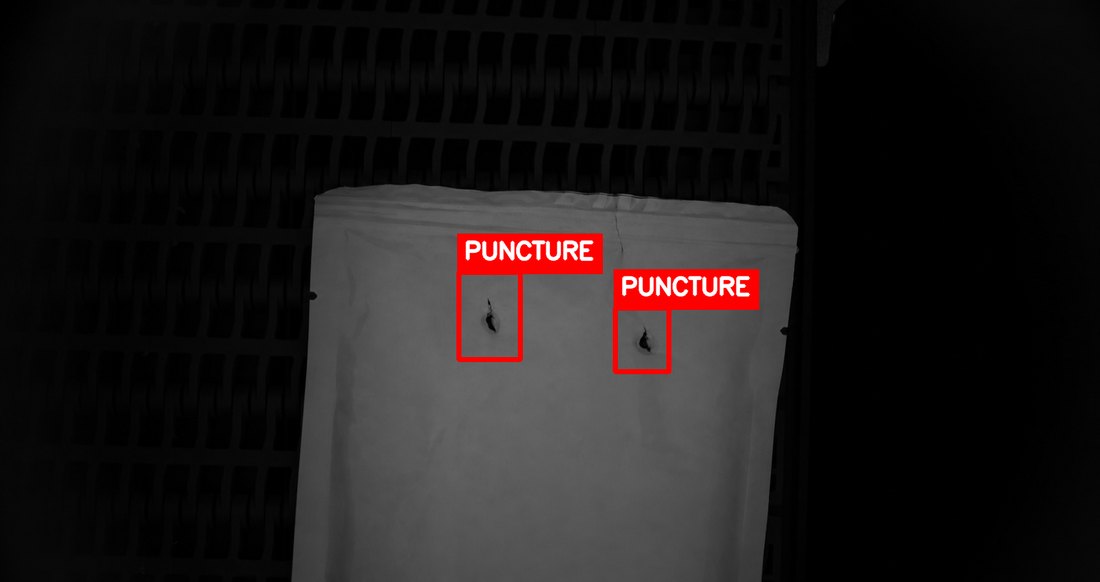
The classes are not fixed: models are trained on the defects your line actually produces. The demonstration set is packaging; the approach is not. Any visual defect a person can see is a candidate, from seal and closure integrity to surface damage, contamination, label and print faults and assembly errors. The engineered imaging chain makes the defect visible; the model turns it into a verdict at line speed.
The next step is free
Start a fit review.
Bring the samples and the line speed. Thirty to sixty minutes later you will know whether this is a candidate for a feasibility study, whether a cheaper sensor solves it, or whether the answer is no.
Documents
The engineering derivation behind every figure on this page is available on request.